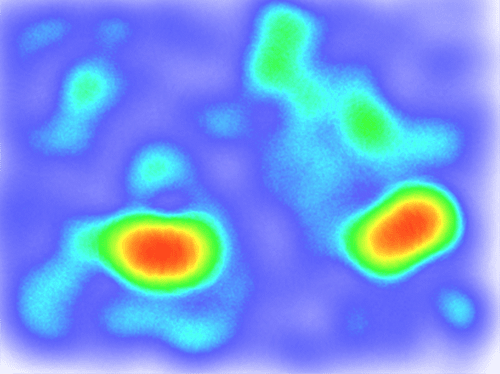
This post introduces how to draw a heatmap chart using Canvas. By the end of the post, you can get the result as shown in the following image.
A heat map is a graphical representation of data where the individual values contained in a matrix are represented as colors. Fractal maps and tree maps both often use a similar system of color-coding to represent the values taken by a variable in a hierarchy. The term is also used to mean its thematic application as a choropleth map.
From Wikipedia
There are plenty of Heatmap JavaScript libraries. So…
Why Bother Making One?
Well, maybe you would just get curious about it one day, as I did.
Step 1. Preparing a Blurring Brush
The brush will be later used to generate the blending effect.
Create a Canvas
We create a new small Canvas of the brush size. Here, we set the brushSize to be 10, which is the radius of the distict brush size, while brushBlurSize is the extra radius of blurring area.
var brushCanvas = document.createElement('canvas');
var brushSize = 10;
var brushBlurSize = 10;
// set brush size
var r = brushSize + brushBlurSize;
var d = r * 2;
brushCanvas.width = d;
brushCanvas.height = d;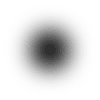 In order to render shadow without the distinct circle, we draw the distinct circle in an invisible place, which is to the left of the canvas in our case. And then, use
 shadowOffset to draw shadow in the center of the canvas. The circle is drawn in black, and is blended with other brushes using alpha value and shadow blur.
var ctx = brushCanvas.getContext('2d');
ctx.shadowOffsetX = d;
ctx.shadowBlur = brushBlurSize;
ctx.shadowColor = 'black';

// draw circle in the left to the canvas

ctx.beginPath();
ctx.arc(-r, r, ecConfig.heatmap.brushSize, 0, Math.PI * 2, true);
ctx.closePath();
ctx.fill();
The brush is shaped as the image in the right shows.
Step 2. Drawing with The Brush
We can generate some random data to see how well our brush works, and may further changing the size of the brush to get a better effect.
var data = [];
for (var i = 0; i < 1000; ++i) {
data.push([Math.random() * 400, Math.random() * 300, Math.random()]);
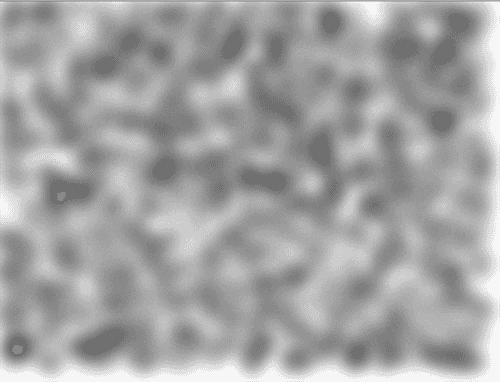
}And use data to draw brushCanvas to a new canvas, we can get the following gray image.
var len = data.length;
for (var i = 0; i < len; ++i) {
    var p = data[i];
    var x = p[0];
    var y = p[1];
    var alpha = p[2]; // using value as alpha


    // draw with the circle brush with alpha

    ctx.globalAlpha = alpha;
    ctx.drawImage(brush, x - r, y - r);
}
Where is my color?!
Hold on…
Step 3. Preparing a Gradient Map
In order to may different darkness into different color in our heatmap, we need a gradient map as a dictionary. Then, we use the alpha value to determine which color to use in the dictionary.
We create a Canvas of 1 x 256 size, in which 256 is the gradient level.
var levels = 256;
var canvas = document.createElement('canvas');
canvas.width = 1;
canvas.height = levels;
var ctx = canvas.getContext('2d');
var gradientColors = {
0.4: 'blue',
0.5: 'cyan',
0.6: 'lime',
0.8: 'yellow',
1.0: 'red'
};
// add color to gradient stops
var gradient = ctx.createLinearGradient(0, 0, 0, levels);
for (var pos in ecConfig.heatmap.gradientColors) {
gradient.addColorStop(pos, gradientColors[pos]);
}
ctx.fillStyle = gradient;
ctx.fillRect(0, 0, 1, levels);
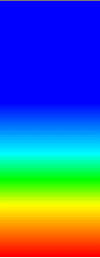
var gradientPixels = ctx.getImageData(0, 0, 1, levels).data;gradientPixels is the pixel array of the gradient canvas. Since each pixel contains red, green, blue, and alpha channel, the length of gradientPixels is 256 * 4, which is 1024.
In order to visualize the gradient map, we set the width a bit wider, as shown in the right image. But remember in gradient, it’s only of 1 pixel wide.
Step 4. Colorize using Gradient Map
Finally!! :joy:
The canvas is colorized by mapping alpha value to the gradient map.
var imageData = ctx.getImageData(0, 0, canvas.width, canvas.height);
var pixels = imageData.data;
var len = pixels.length / 4;
while(len--) {
    var id = len * 4 + 3;
    var alpha = pixels[id] / 256; // why not `gradientLevels`?

    var colorOffset = Math.floor(alpha * (gradientLevels - 1));
    pixels[id - 3] = gradient[colorOffset * 4];     // red

    pixels[id - 2] = gradient[colorOffset * 4 + 1]; // green

    pixels[id - 1] = gradient[colorOffset * 4 + 2]; // blue

}
ctx.putImageData(imageData, 0, 0);
To make the result nicer, we modify our random data generating method.
var data = [];
for (var i = 0; i < 1000; ++i) {
    data.push([Math.random() * 400, Math.random() * 300, Math.random()]);
}
for (var i = 0; i < 100; ++i) {
    data.push([Math.random() * 20 + i / 2 + 100,
        Math.random() * 20 + 200, Math.random()]);
}
for (var i = 0; i < 100; ++i) {
    data.push([Math.random() * 20 + i / 2 + 300,
        Math.random() * 20 - i / 3 + 200, Math.random()]);
}
And now, the heat map is drawn to your Canvas!
Reference
In fact, I read about 3 to 4 Heatmap Chart libraries and most of them are rendered in this way. simpleheat is a small but powerful implementation among them.

